In preparing for my upcoming Rcpp talk at the Oslo useR! Group, I started wondering how much of R is actually written in C or Fortran. I have of course been trained to think that vectorization is great, because then you let C or Fortran do the job, but how much of R is actually written in these languages? Some searching led me to this blog, which analyzes R-2.13.1. However, that post is from 2011, and at the time of writing R has reached version 3-5.2. In addition, the post uses Bash scripts rather than R itself. In this post, I hence reexamine the question, using R all the way, which will be a good exercise. Note that this analysis covers the functions in base R, i.e., stuff like apply(), data.frame(), plot(), and (I guess, but really have no idea) the code that actually makes R run.
I start by defining the R version I want, and the path to which the source file should be saved.
r_version <- "3.5.2"
tarfile <- paste0("./R-", r_version, ".tar.gz")
Then I download the source:
download.file(url = paste0("https://cran.r-project.org/src/base/R-3/R-",
                           r_version, ".tar.gz"),
              destfile = tarfile)
Having downloaded it, I unpack the tar file and remove it. We now have a R-3.5.2 directory.
untar(tarfile)
file.remove(tarfile)
## [1] TRUEI also define the path to the source code, which is in the src subdirectory.
(src_path <- paste0("./R-", r_version, "/src/"))## [1] "./R-3.5.2/src/"In order to see which files are in src, I list all files that end with a . followed by alphanumeric characters.
files <- list.files(src_path, pattern = "\\.[[:alnum:]]+$", recursive = TRUE)Next, I take a first look at all the file endings under src. As we can see, the main languages are C (.c), Fortran (.f) and R (.R).
library(stringr)
(file_count <- table(str_extract(files, "\\.[:alnum:]+$")))
##
## .3 .afm .bib .bmp .c .charset .csv .def
## 1 91 3 1 497 1 2 5
## .dif .dist .doc .enc .f .flate .gz .h
## 1 1 1 18 38 1 15 170
## .hide .html .ico .in .isl .iss .m .manifest
## 2 2 1 82 3 7 1 8
## .mo .modreg .notes .nw .packages .patch .pdf .png
## 279 1 1 1 1 1 18 3
## .po .portsrc .pot .R .rc .Rd .rda .Rnw
## 256 1 25 772 9 1422 9 21
## .RR .Rterm .rtest .rtf .rules .S .save .site
## 5 1 1 1 1 1 10 1
## .svg .tab .tcl .tgz .ts .txt .unix .win
## 1 6 11 15 1 9 1 47
## .windows .y .zi .zip
## 1 3 1 1I now count the number of lines in each C, Fortran, and R file. I use the map function from purrr, which is part of the tidyverse. The pattern "\\.[c|f|R]$" means everything that ends with a period followed by c, f or R.
library(tidyverse)
library(R.utils) # For countLines

stats <- str_subset(files, "\\.[c|f|R]$") %>%
  split(str_extract(., "\\.[c|f|R]$")) %>%
  map_dfr(function(x){
  tibble(
    Lines = sum(map_int(x, ~ countLines(paste0(src_path, .x)))),
    Files = length(x)
  )
    }, .id = "Language") %>%
  mutate(
    Language = recode(Language, `.c` = "C", `.f` = "Fortran", `.R` = "R"),
    LinesPct = paste(100 * round(Lines / sum(Lines), 2), "%"),
    FilesPct = paste(100 * round(Files / sum(Files), 2), "%")
    )
We now have the required numbers, and can make a plot.
ggplot(stats, aes(x = Language, y = Lines, label = LinesPct)) +
  geom_col() +
  geom_text(position = position_stack(vjust = 0.5), color = "white") +
  ggtitle("Number of lines per language in base R")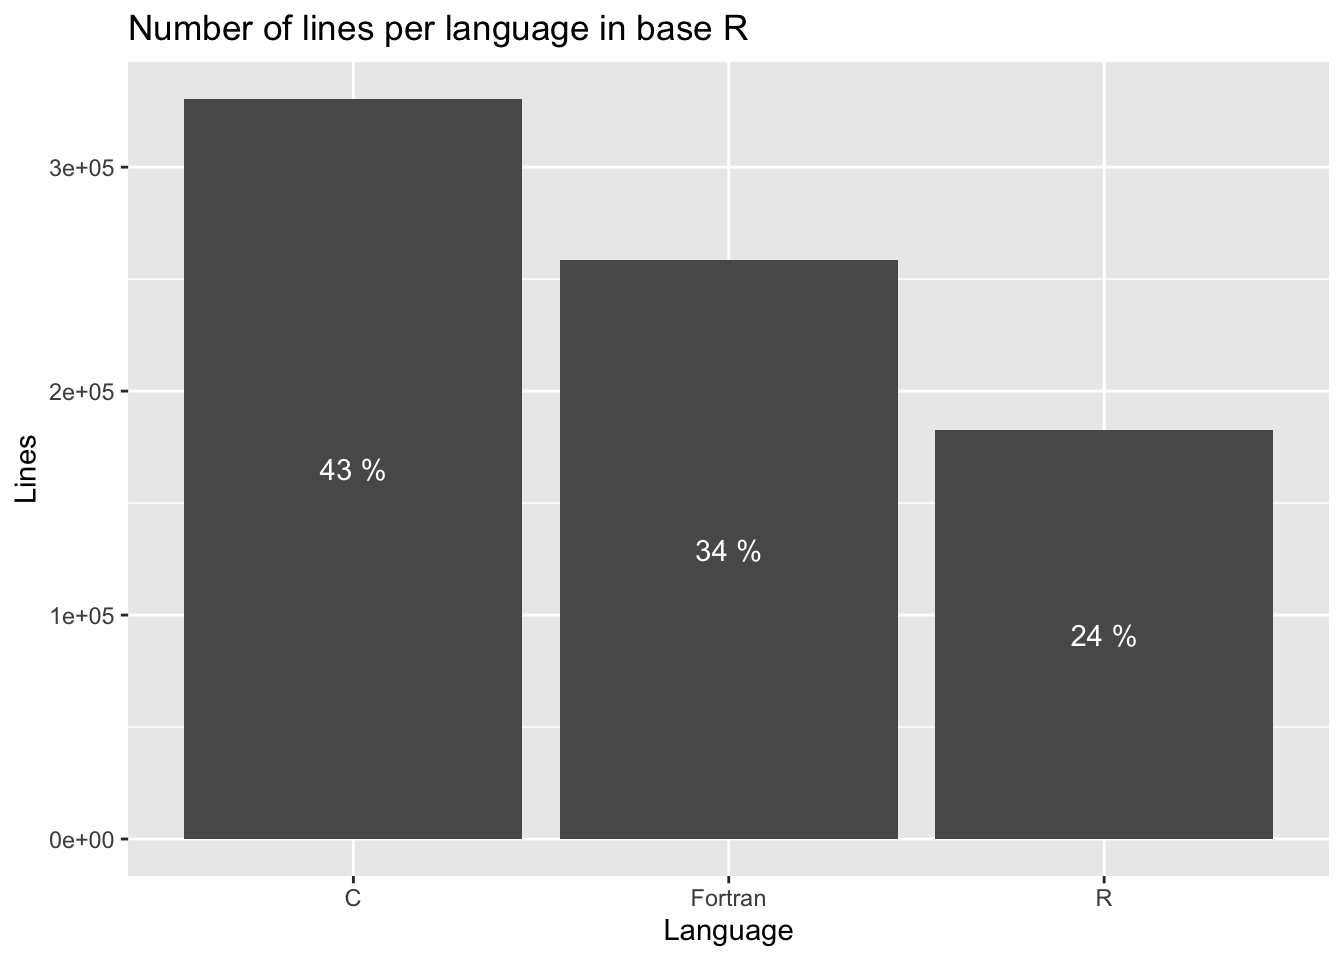
So, the conclusion is that most of base R is written in C or Fortran, at least in terms of lines of code. This is of course good, because it lets us write fast code, e.g., through vectorization.
The number of files per language was shown above, but we can plot this as well.
ggplot(stats, aes(x = Language, y = Files, label = FilesPct)) +
  geom_col() +
  geom_text(position = position_stack(vjust = 0.5), color = "white") +
  ggtitle("Number of lines per language in base R")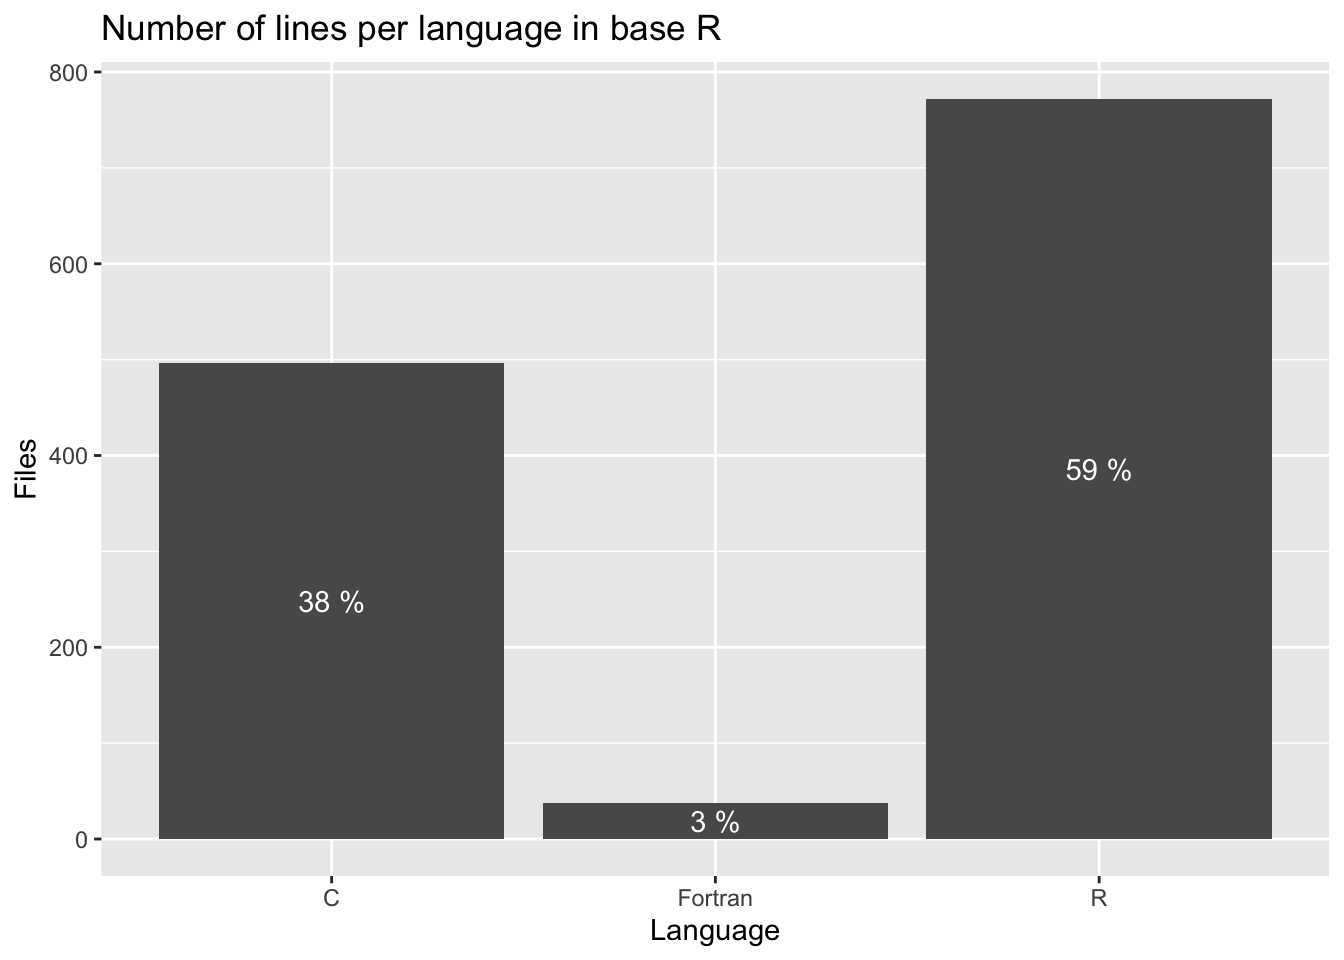
It seems like there are some really long files with Fortran code in there!
Finally I delete the R source code which was downloaded.
unlink(paste0("./R-", r_version), recursive = TRUE)An interesting follow-up would be to study how this has changed over time, and also for CRAN packages.